Note
Click here to download the full example code
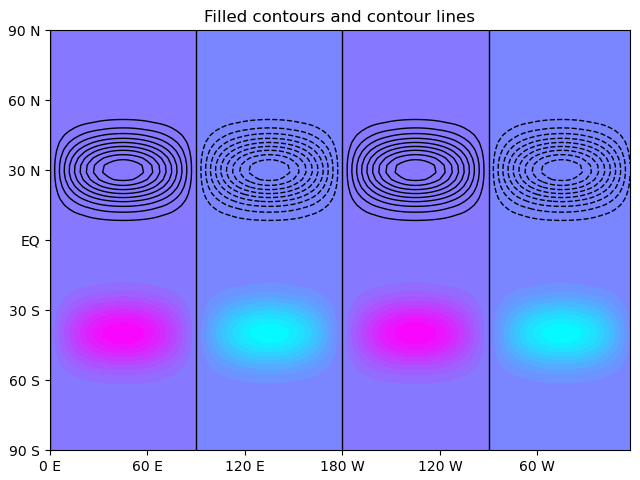
Contour plot
Out:
<Figure size 640x480 with 1 Axes>
import pygeode as pyg, numpy as np
import pylab as pyl

lat = pyg.regularlat(60)
lon = pyg.regularlon(120)

x = pyg.sin(2*np.pi * lon / 180.) * pyg.exp(-(lat - 30)**2 / (2*10**2))
y = pyg.sin(2*np.pi * lon / 180.) * pyg.exp(-(lat + 40)**2 / (2*10**2))

ax = pyg.plot.AxesWrapper()
pyg.vcontour(y, clevs=np.linspace(-1, 1, 21), clines=None, cmap='cool', axes=ax)
pyg.vcontour(x, clevs=None, clines=np.linspace(-1, 1, 21), linewidths = 1., colors='k', axes=ax)

ax.setp(title = 'Filled contours and contour lines')

pyl.ion()

ax.render(1)