Note
Click here to download the full example code
Cartopy: Customizing map decoration
When plotting data on a latitude-longitude grid, showvar will add some default components to a Cartopy map. These can be customized in several ways.
import pygeode as pyg
import numpy as np, pylab as pyl
from cartopy import crs as ccrs
import cartopy
# Construct latitude and longitude coordinate system
lat = pyg.gausslat(40)
lon = pyg.regularlon(80, origin=-180, repeat_origin=True)
# Generate x and y components of a vector field on this coordinate system
T = pyg.cos(4*np.pi * lon / 180.) * pyg.exp(-(lat - 40)**2 / (4*10**2))
T.plotatts['plotname'] = ''
pyl.ioff()
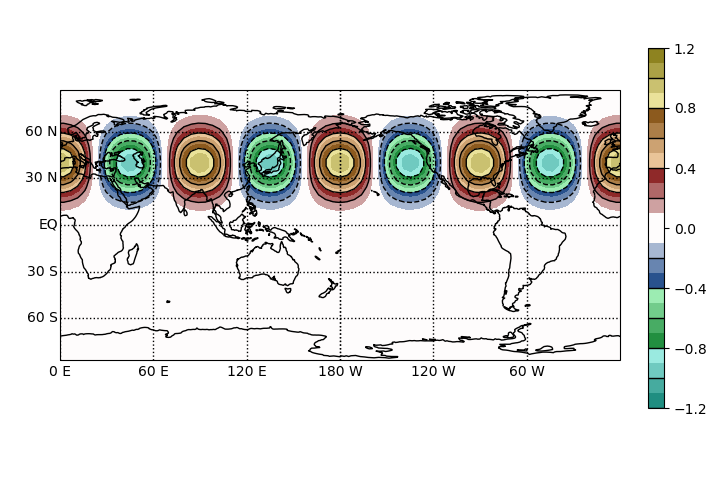
# Simply calling showvar will produce a plot using the PlateCarree (cylindrical) projection
# Set nozero to true to remove the zero contour
ax = pyg.showvar(T, nozero = True)
pyl.ion()
ax.render(1)
Out:
<Figure size 720x480 with 2 Axes>
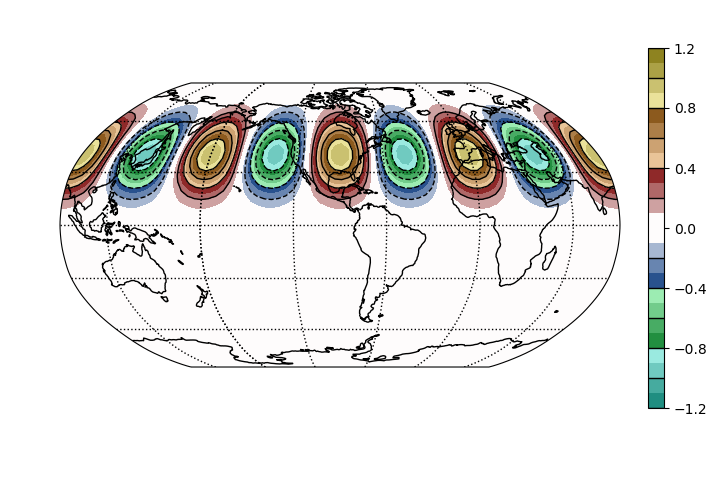
To make this plot more interesting, lets use a Robinson projection. We create a ‘’map’’ dictionary with the name of the projection and any arguments (See the list of projections available).
%%
Out:
<Figure size 720x480 with 2 Axes>
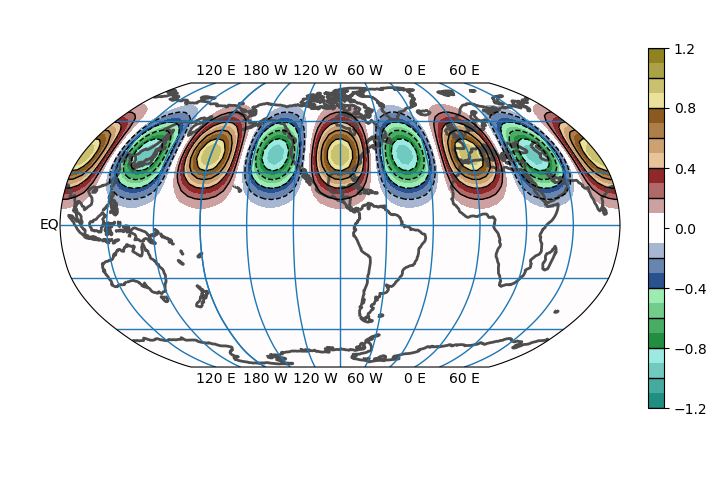
As of Cartopy v0.18, the default labeling of the latitude longitude gridlines is not very legible, so it is turned off for all projections except PlateCarree and Mercator.
We can turn them back on using the ‘’map_decor’’ dictionary. This gives some direct
control over the gridlines and coastlines. See cartopy.mpl.geoaxes.GeoAxes.gridlines()
and cartopy.mpl.geoaxes.GeoAxes.coastlines() for keyword arguments
%%
# Choose custom grid labeling settings
gl = dict(color = 'C0', linestyle = '-', \
          draw_labels=True, \
          x_inline=False, y_inline=False, \
          top_labels=True, bottom_labels=True, left_labels=True, right_labels=True,
          rotate_labels=False, \
          xlocs = pyl.MultipleLocator(30), \
          ylocs = pyl.MultipleLocator(30))

# Set resolution and line style of coastlines
cl = dict(resolution='110m', color='0.3', linewidth=2)

pyl.ioff()

# Create a new plot.
ax = pyg.showvar(T, nozero=True, map = map, mapdecor = dict(gridlines = gl, coastlines = cl))

# Turn on matplotlib interactivity
pyl.ion()

# Produce plot (and use this one for the gallery thumbnail)
# sphinx_gallery_thumbnail_number = 3
ax.render(3)
Out:
<Figure size 720x480 with 2 Axes>
This gallery shows how to modify the appearance of maps by passing in appropriate dictionaries to showvar; another option is to turn off automatic map decorations by passing in ‘’map_decor = False’’. See Add Cartopy Features for an example. %%