Note
Click here to download the full example code
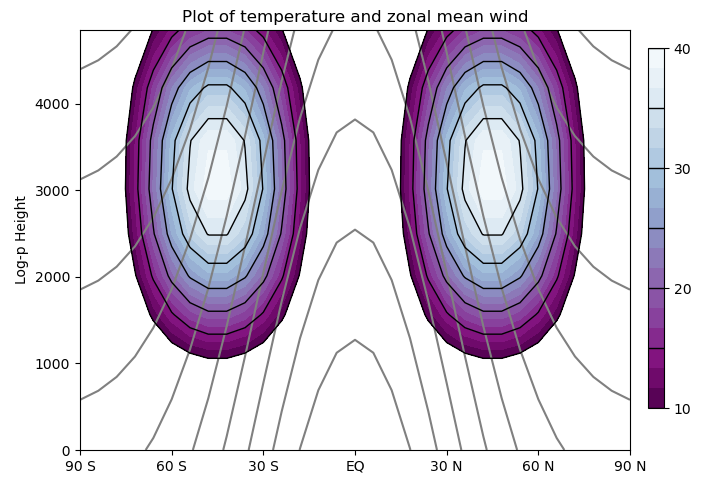
Plot 2 contours and remove the last one
Use showvar() to plot the wind as a filled contour plot and the temperature as grey contour lines on the same axes.
import pylab as pyl

import pygeode as pyg
import numpy as np
from pygeode.tutorial import t2

pyl.ioff()
# Load Temperature and zonal wind
u = t2.U(time='10 May 2002', pres=(1000,500)).mean(pyg.Lon)
T = t2.Temp(time='10 May 2002', pres=(1000,500)).mean(pyg.Lon)

# Change vertical axis to log(pressure) with a scale height of 7 km
u_H = u.replace_axes(pres=u.pres.logPAxis(H=7000))
T_H = T.replace_axes(pres=T.pres.logPAxis(H=7000))

ax = pyg.plot.AxesWrapper()

pyg.showvar(T_H, clines=10, colors='grey', axes=ax)
ax_wrapper =pyg.showvar(u_H, min=10, cdelt=10, ndiv=3, fig=1, cmap=pyl.cm.BuPu_r, axes=ax)

ax.setp(title = 'Plot of temperature and zonal mean wind')
pyl.ion()
ax_wrapper.render()
Out:
<Figure size 720x480 with 2 Axes>
ax_wrapper.axes[0].plots contains a list of all the plotted objects
print(*ax_wrapper.axes[0].plots, sep="\n")
Out:
<pygeode.plot.wrappers.Contour object at 0x7f217ac3c3d0>
<pygeode.plot.wrappers.Contourf object at 0x7f217af9de20>
<pygeode.plot.wrappers.Contour object at 0x7f217ac3c820>
<pygeode.plot.wrappers.Colorbar object at 0x7f217ac3cd30>
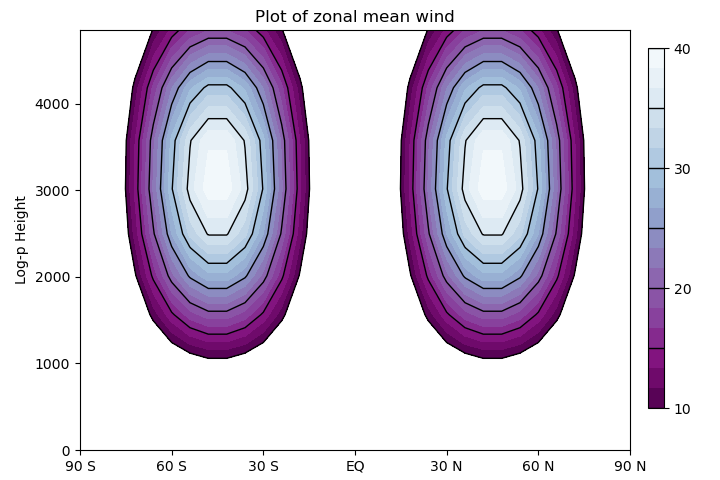
Remove the temperatue contours from the list and plot the zonal wind contours and colourbar only.
ax_wrapper.axes[0].plots = ax_wrapper.axes[0].plots[1:]

ax.setp(title = 'Plot of zonal mean wind')
ax_wrapper.render()
Out:
<Figure size 720x480 with 2 Axes>
print(*ax_wrapper.axes[0].plots, sep="\n")
Out:
<pygeode.plot.wrappers.Contourf object at 0x7f217af9de20>
<pygeode.plot.wrappers.Contour object at 0x7f217ac3c820>
<pygeode.plot.wrappers.Colorbar object at 0x7f217ac3cd30>