Note
Click here to download the full example code
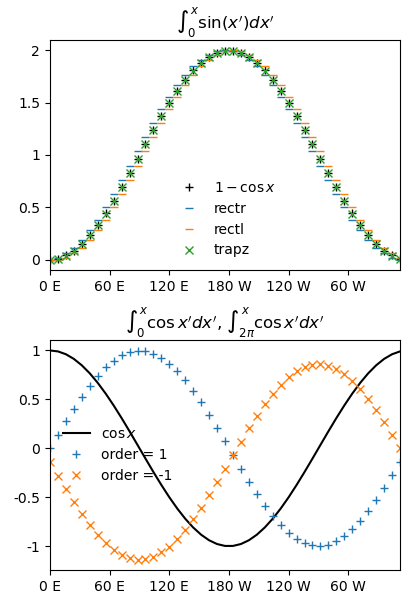
Plot lines using showlines
Compute numerical integrals using Var.integrate() and use showlines() to make plot
Out:
<Figure size 410x600 with 2 Axes>
import pygeode as pyg, numpy as np
import pylab as pyl

# Use longitudes as horizontal axis
x = pyg.regularlon(45)

lam = np.pi * x / 180.

pyl.ioff()

# Example 1: f = sin(x)
# F = int_0^x f dx' = 1 - cos(x)
# Different integration methods

f = pyg.sin(lam)

Fr = f.integrate('lon', dx = lam, type='rectr')
Fl = f.integrate('lon', dx = lam, type='rectl')
Ft = f.integrate('lon', dx = lam, type='trapz')

ax1 = pyg.showlines([1 - pyg.cosd(x), Fr, Fl, Ft],
                   fmts = ['k+', '_', '_', 'x'],
                   labels = [r'$1 - \cos x$', 'rectr', 'rectl', 'trapz'], fig=3)

# Set panel title and axes labels
ax1.setp(title = r"$\int_0^x \sin(x') dx'$", ylabel = '')
# Adjust size and axis padding
ax1.size = (4.1, 3)
ax1.pad = [0.5, 0.3, 0.1, 0.4]

# Example 2: f = cos(x)
# Different integration directions

f = pyg.cos(lam)

Ff = f.integrate('lon', dx = lam, order=1)
Fb = f.integrate('lon', dx = lam, order=-1)

ax2 = pyg.showlines([f, Ff, Fb],
                   fmts = ['k', '+', 'x'],
                   labels = [r'$\cos x$', 'order = 1', 'order = -1'], fig=3)

# Set panel title and axes labels
ax2.setp(title = r"$\int_0^x \cos x' dx'$, $\int_{2\pi}^x \cos x' dx'$", ylabel = '')
# Adjust size and axis padding
ax2.size = (4.1, 3)
ax2.pad = [0.5, 0.3, 0.1, 0.4]

ax = pyg.plot.grid([[ax1], [ax2]])
pyl.ion()

ax.render()