Note
Click here to download the full example code
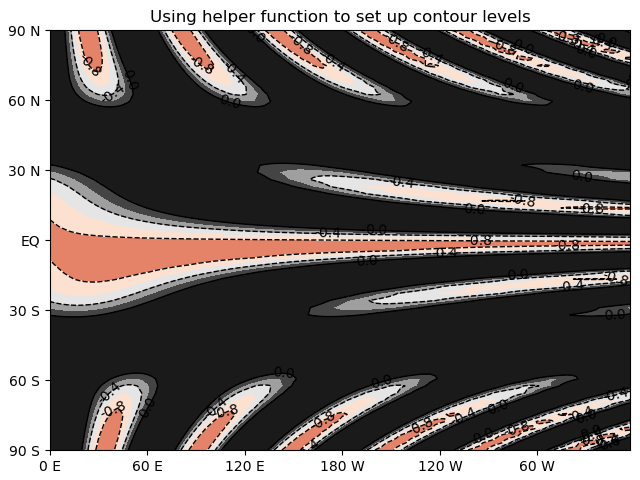
Specify contour levels
Use clfdict() to create a set of contour levels and contour lines to plot.
import pygeode as pyg, numpy as np
import pylab as pyl
pyl.ioff()

lat = pyg.regularlat(60)
lon = pyg.regularlon(120)

z =pyg.sin(2*np.pi*lat/180.)**10 + pyg.cos(10 + (2*np.pi/180.)**2*lat*lon) * pyg.cos(2*np.pi*lat/180.)

ax = pyg.plot.AxesWrapper()

contour_dict = pyg.clfdict(min=-1.2, axes=ax, cdelt=0.4, ndiv=3, nf=2, nl=1, extend='both', cmap='RdGy')

pyg.vcontour(z, **contour_dict)
ax.setp(title = 'Using helper function to set up contour levels')
ax.clabel(ax.plots[1], colors='k', fmt='%.1f', fontsize=10, inline=False)

pyl.ion()
ax.render()
Out:
/home/peterh/pygeode/pygeode/plot/wrappers.py:306: UserWarning: The following kwargs were not used by contour: 'colorbar'
  self._cnt = axes.contourf (*self.plot_args, **self.plot_kwargs)
/home/peterh/pygeode/pygeode/plot/wrappers.py:299: UserWarning: The following kwargs were not used by contour: 'colorbar'
  self._cnt = axes.contour (*self.plot_args, **self.plot_kwargs)

<Figure size 640x480 with 1 Axes>
contour_dict contains a dictionary of the various plotting parameters
print(contour_dict)
Out:
{'clevs': array([-1.20000000e+00, -1.00000000e+00, -8.00000000e-01, -6.00000000e-01,
       -4.00000000e-01, -2.00000000e-01,  2.22044605e-16]), 'clines': array([-1.20000000e+00, -8.00000000e-01, -4.00000000e-01,  2.22044605e-16]), 'colorbar': {'ticks': array([-1.20000000e+00, -8.00000000e-01, -4.00000000e-01,  2.22044605e-16])}, 'linewidths': 1.0, 'cmap': 'RdGy', 'axes': <pygeode.plot.wrappers.AxesWrapper object at 0x7f217b0e6df0>, 'extend': 'both'}
ax.plots contains a list of the various pygeode plot objects
print(ax.plots)
Out:
[<pygeode.plot.wrappers.Contourf object at 0x7f217b0e6d90>, <pygeode.plot.wrappers.Contour object at 0x7f217b0fe4f0>, <pygeode.plot.wrappers.CLabel object at 0x7f217b0acc40>]