Note
Click here to download the full example code
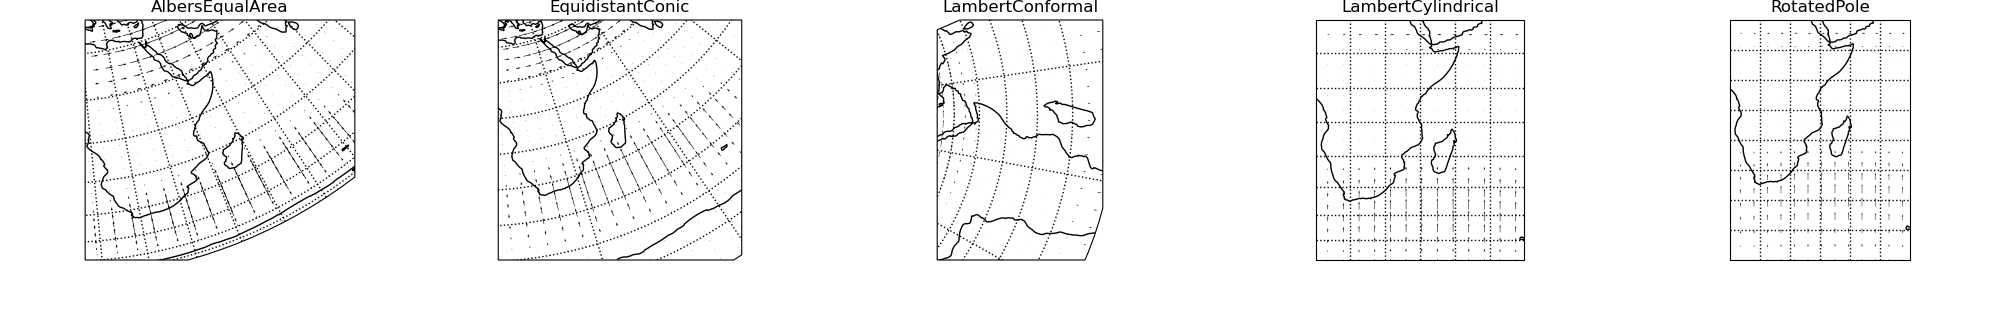
Cartopy: Test regional projections
Out:
<Figure size 2000x310 with 5 Axes>
import pygeode as pyg, numpy as np, pylab as pyl
from cartopy import crs as ccrs
import cartopy

lat = pyg.gausslat(40)
lon = pyg.regularlon(80, origin=-180)

x = pyg.sin(2*np.pi * lon / 180.) * pyg.exp(-(lat - 30)**2 / (2*10**2))
y = pyg.sin(2*np.pi * lon / 180.) * pyg.exp(-(lat + 40)**2 / (2*10**2))

pyl.ioff()

prj_grid = ['PlateCarree', 'Mercator', 'Miller', 'TransverseMercator']
prj_reg  = ['AlbersEqualArea', 'EquidistantConic', 'LambertConformal', \
            'LambertCylindrical', 'RotatedPole']
prj_glob = ['AzimuthalEquidistant', 'Mollweide', 'Orthographic',  \
            'Stereographic', 'Robinson', 'Sinusoidal', \
            'Geostationary', 'LambertAzimuthalEqualArea', 'EckertIII']

prj = dict(central_longitude=60.)
gridlines = dict(draw_labels = False, xlocs = range(0, 361, 30), ylocs = range(-80, 81, 20)),
map = dict(gridline = gridlines)

i = 0
axr = []

for p in prj_reg[:]:
    if i == 5:
        axg.append(axr)
        axr = []
        i = 0

    ax = pyg.plot.CartopyAxes(projection = p)#, prj_args = prj)

    pyg.vquiver(x, y, axes = ax, map = map)
    ax.size = [4., 3.1]
    ax.setp(title = p)
    ax.set_extent([10, 70, -60, 20], crs = ccrs.PlateCarree())
    axr.append(ax)
    i += 1

ax = pyg.plot.grid([axr])

pyl.ion()
ax.render(2)